Getting Started
Here you will find information on how to begin writing instrumentation in the Whamm DSL.
Installation
The current way to install Whamm is to clone the repository, build the source yourself, and add the created binary to your PATH variable.
In the future, users will be able to download pre-built binaries on the GH releases page as we have stable, tagged releases of Whamm.
Steps:
- Clone the
Whammrepo - Build the source code with
cargo build --release - Add the built binary to your
PATH. This binary should be located attarget/release/whamm1.
Basic Test
A basic test you can run to make sure that the Whamm binary is on your path and working as-expected is running the following command: whamm --help.
The CLI will provide information on various commands and options available for use.
Wasm monitors and manipulators
As mentioned in the introduction, Whamm can be used to either monitor OR manipulate a program’s execution.
What we mean by monitor execution is collect some information about a program’s dynamic behavior. This is commonly used for debugging, logging, and metric collection.
What we mean by manipulate execution is to literally change the program’s dynamic behavior.
Consider a specific feature of many debugger tools: using a debugger, a developer can set a breakpoint, inspect the current application state, and change the values of variables.
This is an example of manipulating an application’s dynamic behavior through changing the state and something we will support doing in Whamm.
Continue reading through this book’s “getting started” content for how to write such monitors and manipulators.
Anatomy of Instrumentation in Whamm
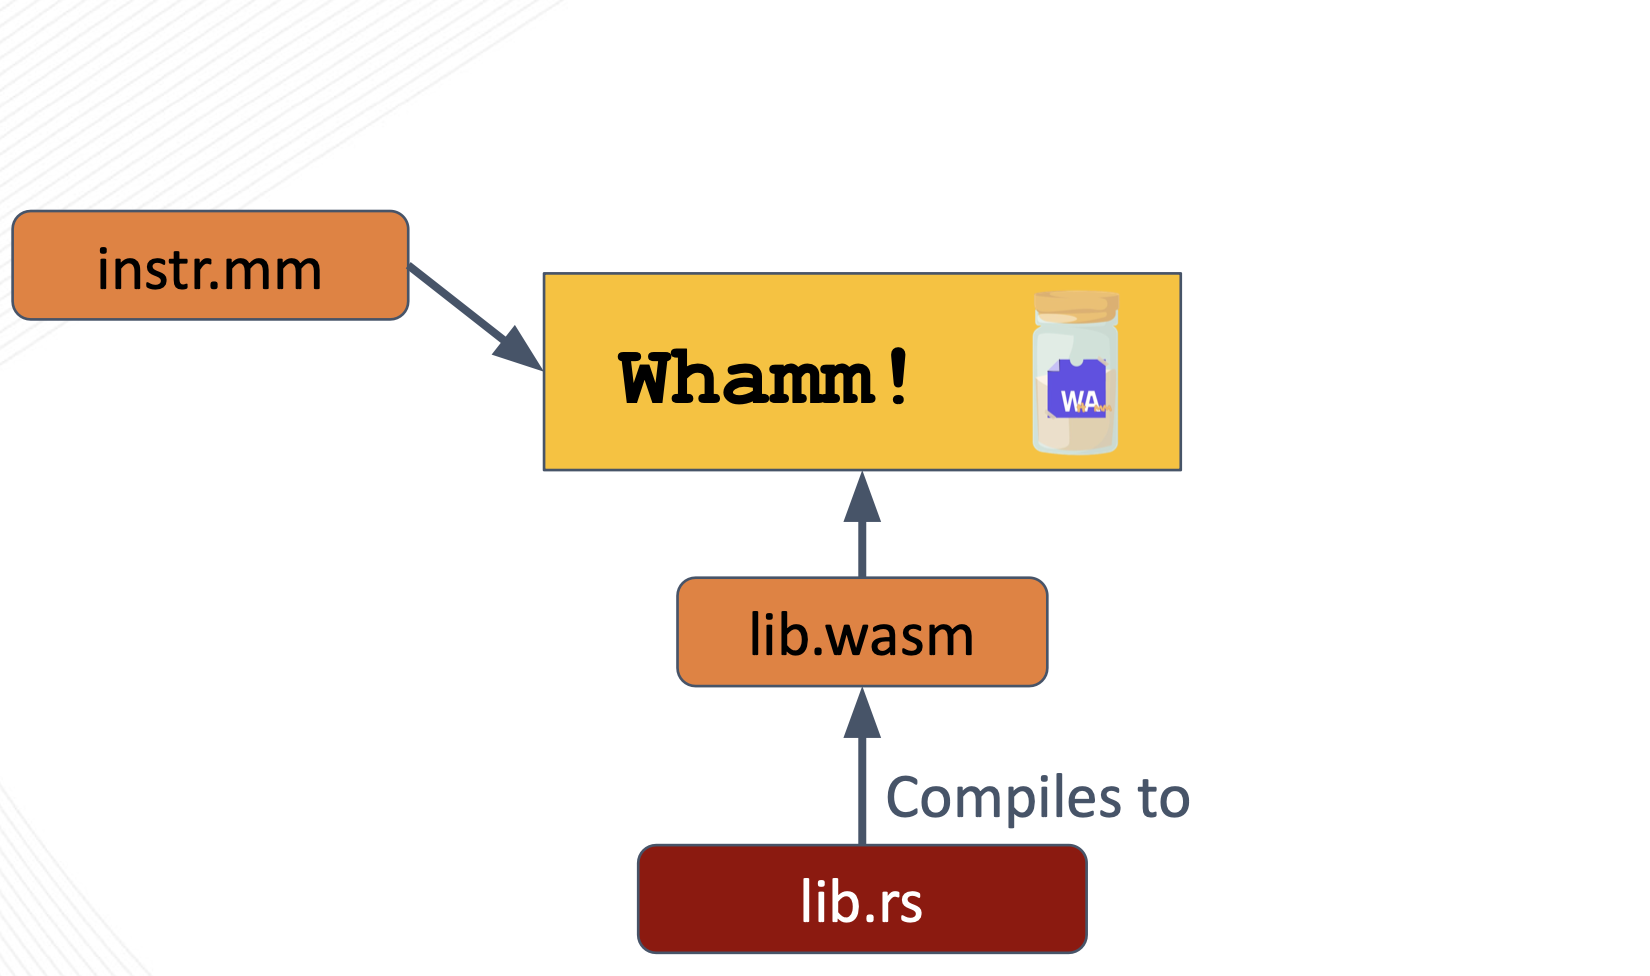
The core anatomy of instrumentation written in Whamm consists of the Whamm script (instr.mm) and the instrumentation library (instr.wasm).
Together, these files tell the Whamm compiler where to insert instrumentation and what logic to inject at those points.
instr.mm
Where to insert instrumentation.
This Whamm script describes a unit of instrumentation by specifying the points to probe in an application using the probe syntax.
These probes contain the logic to inject at these match point in their bodies.
The DSL is expressive enough to support some monitoring use cases; however, to keep from DSL scope creep, we have decided to offload general-purpose programmability to any source language that can compile to Wasm.
A script can call out to such a user’s instrumentation library, provided as lib.wasm.
lib.wasm
What logic to insert at the targeted application points.
It is optional to provide this library to Whamm.
It is only necessary if the user would prefer to write their instrumentation in a higher-level language or if the DSL does not have some syntax/tool necessary for the instrumentation logic.
This language must compile to Wasm as the library must be provided to the Whamm compiler as a Wasm file.
The user will need to keep in mind that the function signatures in their library that will be called in their probe bodies will need to have types compatible with the types currently provided by Whamm.
Otherwise, Whamm will not be able to compile their instrumentation code.
Helpful Tools
Here are some tools that may help when working with Wasm:
wabt, aka the WebAssembly Binary Toolkitwasm-tools
1: We recommend adding the binary built inside target/ to your path as this will enable you to pull the latest changes on master, build the latest version, and automatically have the latest binary on your PATH.