Introduction
Debugging Wasm? Put some Whamm on it!
If you’re building a new dynamic analysis for Wasm and are looking for a framework to support you, you’re in the right place!
Whamm is a framework for “Wasm Application Monitoring and Manipulation”1.
This book will help you get on the right track when working with the language.
Tools in the Whamm framework are expressed using its domain-specific language (DSL).
The DSL is inspired by Dtrace’s D language.
The Whamm DSL enables Wasm tool implementers to express their instrumentation using high-level abstractions of program events or locations at various levels of granularity.
Here are some of the goals of the Whamm DSL:
- is high-level and intuitive
- instrumentation is easy-to-build, testable, and debuggable
- express instrumentation in terms of predicated probes
- can instrument events of different granularity
- provide behavior as Wasm functions, say where to call them in
Whamm - write instrumentation once,
Whammtakes care of the injection strategy.
A tool written in the Whamm framework can be applied using an engine’s dynamic instrumentation capabilities or bytecode rewriting (if such capabilities aren’t available).
You can use the same tool for either strategy, Whamm takes care of the injection!
Through providing such portability, Whamm broadens the applicability of tools, reducing tooling fragmentation across source languages (since Wasm is a polyglot) and Wasm engine (since it has the bytecode rewriting fallback that runs anywhere).
Let’s take a moment to consider the scale of impact that this DSL could have on developer tooling by considering the following facts:
- WebAssembly is growing to use cases beyond the browser.
- Many languages can compile to Wasm.
- With
Whammwrite instrumentation once to support wide domain of apps.- Use engine instrumentation capabilities as available.
- Use bytecode rewriting to support everything else.
This means that developer tools written in Whamm could support a vast domain of applications, making WebAssembly the future target platform for debugging.
Resources
Injection strategies:
- Paper describing the non-intrusive injection strategy used by
Whamm: Flexible Non-intrusive Dynamic Instrumentation for WebAssembly - The library used to do the intrusive injection strategy (bytecode rewriting): wirm
Some helpful terms and concepts
- WebAssembly (Wasm): WebAssembly is a binary instruction format for a stack-based virtual machine. It is designed as a portable compilation target for programming languages.
- Instrumentation: When we say we are “instrumenting a program,” at a high-level we mean we are “injecting some code into a program’s execution to do some operation.” This definition is intentionally generic since instrumentation can really do anything we can imagine! You can use instrumentation to build debuggers, dynamic analyses, telemetry generators, and more.
- Dynamic analysis: A dynamic analysis is something that analyzes a program as it is executing (in contrast to a static analysis which analyzes a program that is not running). This type of analysis can gain useful insights into a program as it is able to access information that is not available statically (such as hot code locations, memory accesses over time, code coverage of test suites, etc.).
- Bytecode rewriting: This is an example strategy for injecting instrumentation logic into the application. It injects instrumentation through literally inserting new instructions into the application bytecode.
1: The ‘h’ is silent.
Getting Started
Here you will find information on how to begin writing instrumentation in the Whamm DSL.
Installation
The current way to install Whamm is to clone the repository, build the source yourself, and add the created binary to your PATH variable.
In the future, users will be able to download pre-built binaries on the GH releases page as we have stable, tagged releases of Whamm.
Steps:
- Clone the
Whammrepo - Build the source code with
cargo build --release - Add the built binary to your
PATH. This binary should be located attarget/release/whamm1.
Basic Test
A basic test you can run to make sure that the Whamm binary is on your path and working as-expected is running the following command: whamm --help.
The CLI will provide information on various commands and options available for use.
Wasm monitors and manipulators
As mentioned in the introduction, Whamm can be used to either monitor OR manipulate a program’s execution.
What we mean by monitor execution is collect some information about a program’s dynamic behavior. This is commonly used for debugging, logging, and metric collection.
What we mean by manipulate execution is to literally change the program’s dynamic behavior.
Consider a specific feature of many debugger tools: using a debugger, a developer can set a breakpoint, inspect the current application state, and change the values of variables.
This is an example of manipulating an application’s dynamic behavior through changing the state and something we will support doing in Whamm.
Continue reading through this book’s “getting started” content for how to write such monitors and manipulators.
Anatomy of Instrumentation in Whamm
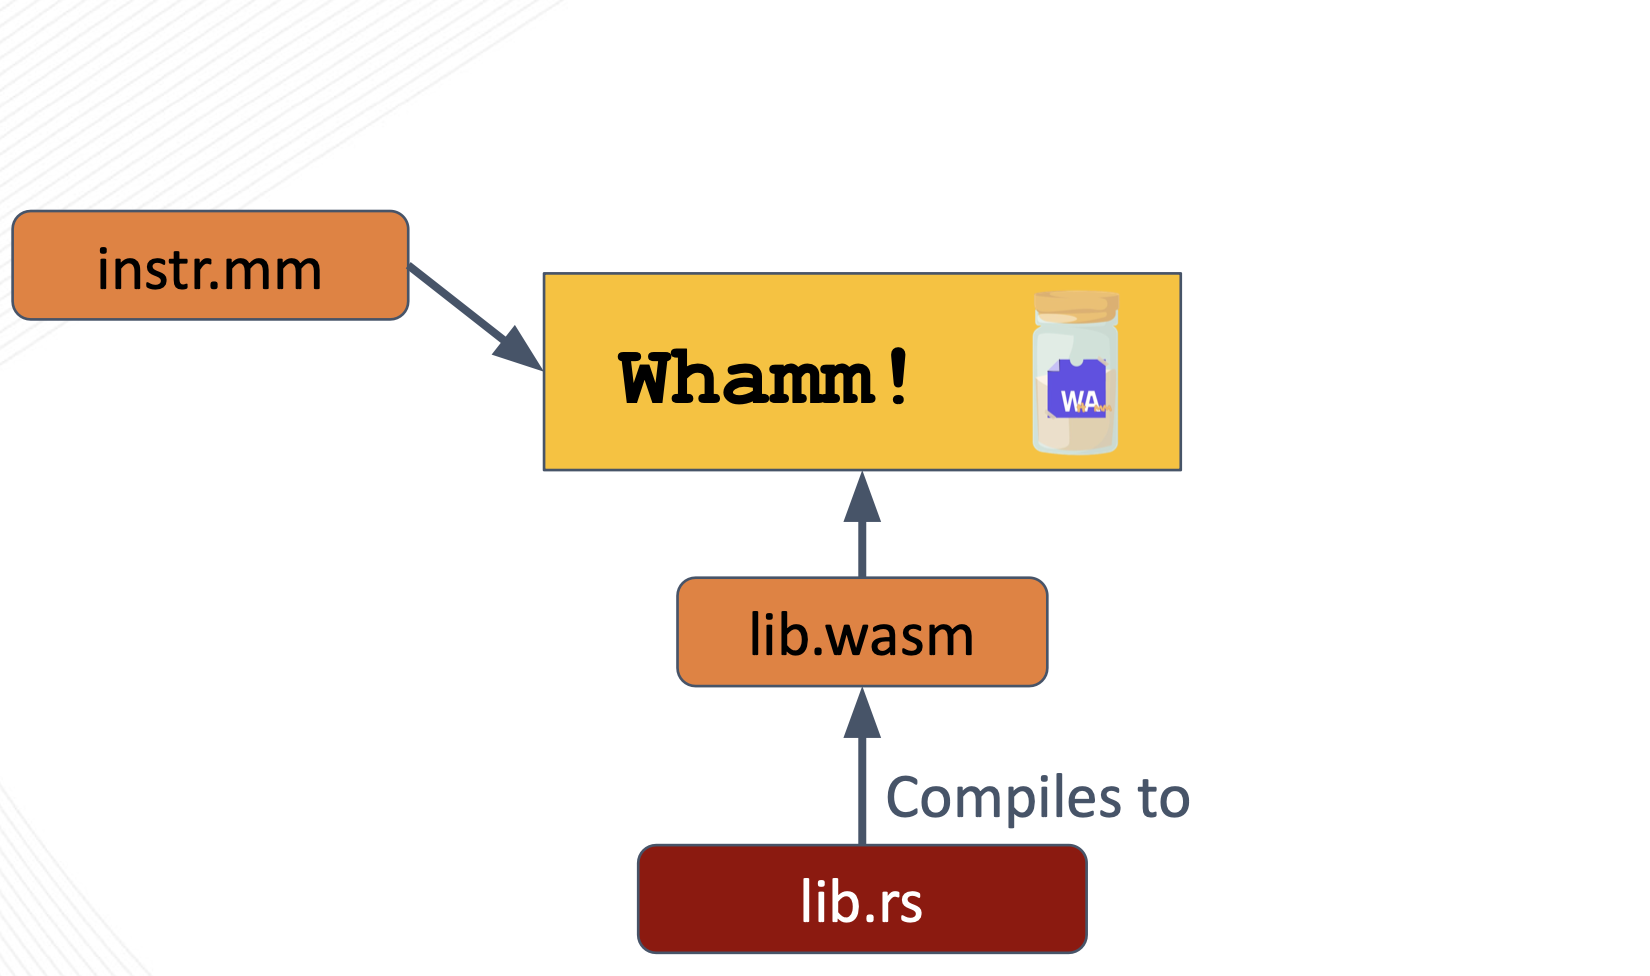
The core anatomy of instrumentation written in Whamm consists of the Whamm script (instr.mm) and the instrumentation library (instr.wasm).
Together, these files tell the Whamm compiler where to insert instrumentation and what logic to inject at those points.
instr.mm
Where to insert instrumentation.
This Whamm script describes a unit of instrumentation by specifying the points to probe in an application using the probe syntax.
These probes contain the logic to inject at these match point in their bodies.
The DSL is expressive enough to support some monitoring use cases; however, to keep from DSL scope creep, we have decided to offload general-purpose programmability to any source language that can compile to Wasm.
A script can call out to such a user’s instrumentation library, provided as lib.wasm.
lib.wasm
What logic to insert at the targeted application points.
It is optional to provide this library to Whamm.
It is only necessary if the user would prefer to write their instrumentation in a higher-level language or if the DSL does not have some syntax/tool necessary for the instrumentation logic.
This language must compile to Wasm as the library must be provided to the Whamm compiler as a Wasm file.
The user will need to keep in mind that the function signatures in their library that will be called in their probe bodies will need to have types compatible with the types currently provided by Whamm.
Otherwise, Whamm will not be able to compile their instrumentation code.
Helpful Tools
Here are some tools that may help when working with Wasm:
wabt, aka the WebAssembly Binary Toolkitwasm-tools
1: We recommend adding the binary built inside target/ to your path as this will enable you to pull the latest changes on master, build the latest version, and automatically have the latest binary on your PATH.
The Language
Whamm enables tool implementers to express their instrumentation in terms of program events and corresponding predicated actions;
“When this event occurs during program execution, do these actions if this predicate (or conditional) evaluates to true.”
This abstraction provides a high-level and intuitive syntax that can target events at various granularities in the target program.
Read on for an overview of the syntax and semantics of the language.
Language Concepts
- Variables are used to store data.
- Logical operations can be used to combine boolean expressions.
- Ternary Expressions can be used for succinct conditional variable assignments.
- Primitive types are numbers, booleans, and strings.
- Various arithmetic operations can be used with numbers.
- Strings are key for dealing with text, etc.
- Tuples allow using multiple values where one value is expected.
- Maps are key for storing large amounts of data, but they’re implemented quite differently in
Whamm. - Function definitions can be used to reuse code snippets.
- Conditionals are if/else/elif statements used for simple control flow.
- Type Bounds are for dealing with polymorphic opcodes.
Whammalso provides helpful features to enable instrumentation expressiveness.- Report variables are key for flushing the dynamic data collected by instrumentation during an application’s run.
- Unshared variables are used to create an instance of a variable per probe match-site whose value is retained across site visits.
- Shared variables are used to create an instance of a variable that is shared by every probe match-site.
- Frame variables are used to create an instance of a variable that is stored on a function’s active frame.
- And finally, probes are used to express instrumentation.
- All of this syntax is used to write
Whammscripts.
Variables
Variables store data, such as numbers and strings.
// Declaring a new variable `<type> <var_name>;`:
var i: i32;
// Assigning a value to a variable `<var_name> = <value>;`:
i = 0;

// Variables can also be set to the result of an expression `<var_name> = <expression>;`:
i = 1 + 2;
i = add(1, 2) + 9; // (assuming that the `add` fn is in scope and returns an `i32`)
Scopes
Each variable is associated with some scope, which is the range of the program in which it is active and accessible. We will see how there are scopes tied to functions, probes, and scripts. The syntax for declaring and assigning to variables is consistent across these contexts.
Logical Operators
Logical operators allow joining multiple boolean expressions.
Like C/C++ and Java, the && and || operators provide for logical-and and logical-or.
Both operators have short-circuit evaluation; they only evaluate the right-hand-side expression if the left-hand-side evaluates to true or false, respectively.
var a: bool;
a = false && false; // == false
a = false && true;  // == false
a = true && false;  // == false
a = true && true;   // == true
var a: bool;
a = false || false; // == false
a = false || true;  // == true
a = true || false;  // == true
a = true || true;   // == true
Ternary Expressions
Whamm supports a version of the “conditional” expression that chooses one of two values based on a condition.
The syntax follows C, C++, and Java, which uses ? :.
// with declared types
var a: i32;
a = 1 > 0 ? 16 : 27; // == 16
a = 1 < 0 ? 17 : 29; // == 29
Short-circuit evaluation
The ternary expression will only evaluate the branch corresponding to the value of the condition. In other words, it short-circuits.
Primitives
Whamm offers a small set of primitive types that are useful for performing arithmetic and representing data.
Booleans
With only two values, true, and false, booleans are represented in Whamm with the type bool.
var x: bool; // default == false
x = true;
x = false;
Integers
Right now, Whamm supports the following types:
| type | bits | description | min | max |
|---|---|---|---|---|
u8 | 8 | unsigned values | 0 | 255 (equal to 2^8 - 1) |
i8 | 8 | signed values | -128 (equal to -2^7) | 127 (equal to 2^7 - 1) |
u16 | 16 | unsigned values | 0 | 65_535 (equal to 2^16 - 1) |
i16 | 16 | signed values | -32_768 (equal to -2^15) | 32_767 (equal to 2^15 - 1) |
u32 | 32 | unsigned values | 0 | 4_294_967_295 (equal to 2^32 - 1) |
i32 | 32 | signed values | -2_147_483_648 (equal to -2^31) | 2_147_483_647 (equal to 2^31 - 1) |
f32 | 32 | floating point values | -3.40282347E+38 | 3.40282347E+38 |
u64 | 64 | unsigned values | 0 | 4_294_967_295 (equal to 2^32 - 1) |
i64 | 64 | signed values | -2_147_483_648 (equal to -2^31) | 18_446_744_073_709_551_615 (equal to 2^63 - 1) |
f64 | 64 | floating point values | -1.7976931348623157E+308 | 1.7976931348623157E+308 |
// with declared types
var d: i32; // default == 0
d = 0;
d = 9993;
d = -42;
Arithmetic
Arithmetic is fundamental to computation.
Whamm defines a number of arithmetic operators on the primitive types.
Integer types
var a: i32;
a = 0;
a++;       // increment == 1
a--;       // decrement == 0
a = 9 + 3; // add == 12
a = 8 - 2; // subtract == 6
a = 7 * 4; // multiply == 28
a = 9 / 2; // divide == 4
a = 5 % 3; // modulus == 2
Strings
Whamm has very basic support for strings; they are injected into the instrumented Wasm program
and are represented as the tuple: (memory_address, length). Only static strings can be defined,
e.g. "i'm a string", no dynamic string creation is supported (yet), e.g. "i " + " am " + " groot".
However, as a workaround, you can pull a string from a user library to get this functionality.
var a: str = "";
var b: str = "The quick brown fox";
// var c: string = null; // INVALID -- strings cannot be set to null
Escapes
Strings can use the \ character to escape some sequences including:
\nnewline\ttab\"double quote\'single quote\\backslash\0null byte\x(HEX_DIGIT{2})to insert hex\u(HEX_DIGIT+)to insert unicode
// encodes the string literal: "hello drop😀😀A"
report var s: str = "hello drop\u{1F600}😀\x41\n";
Utilities
The following utilities are provided for string operations:
var s: str = "test";

/// Returns the length of the string.
/// This length is in bytes, not chars or graphemes. In other words, it might not be
/// what a human considers the length of the string.
var l: u32 = s.len();

/// Returns true if the given pattern matches a prefix of this string slice.
/// Returns false if it does not.
var r0: bool = s.starts_with("te");    // `true`
var r1: bool = s.starts_with("st");    // `false`

/// Returns true if the given pattern matches a suffix of this string slice.
/// Returns false if it does not.
var r2: bool = s.ends_with("te");      // `false`
var r3: bool = s.ends_with("st");      // `true`

/// Returns true if the given pattern matches a sub-slice of this string.
/// Returns false if it does not.
var r4: bool = s.contains("te");       // `true`
var r5: bool = s.contains("NA");       // `false`
Strings and Libraries
Strings can be passed to / pulled from libraries through memory operations. To have this work in your own libraries, you will have to expose functions to allocate/free memory.
Write to a library:
use whamm_core;

wasm:opcode:drop:before {
    // initialize the string to pass
    var s: str = "hello world!";
    var l: u32 = s.len();

    // allocate the right number of bytes to store the string
    var ptr: i32 = whamm_core.mem_alloc(l as i32);

    // write the string to the target library's memory
    write_str(memid(whamm_core), ptr, s);

    // call a function in the library that uses the passed string
    // (this just prints the string)
    whamm_core.puts(ptr, l as i32);

    // free the allocated memory
    whamm_core.mem_free(ptr);
}
Pull from a library:
use alpha;

wasm:opcode:drop:before {
    // allocate some space in memory to store the library's string
    var MAX: i32 = 100;
    var ptr: i32 = alpha.mem_alloc(MAX);

    // write a string to memory, return the length of the string written
    var l: i32 = alpha.write_alphabet(ptr, MAX);

    // read the string from the library's memory
    var s: str  = read_str(memid(alpha), ptr, l as u32);

    // free the memory we've just used
    alpha.mem_free(ptr);
}
Tuples
Tuples provide a quick and easy way to combine one or more values into a composite value.
var a: (i32, i32);
a = (0, 1);

var b: (bool, i32);
b = (true, 78);
Member access
Tuple elements can be accessed as if they were fields of the tuple value.
Instead of field names, the elements are named as integer literals, starting with 0.
// tuple members are accessed with '.' and numbered from 0
var a: (bool, i32);
a = (true, 1);

var b: bool;
b = a.0;    // == true

var c: i32;
c = a.1;    // == 1

var d: (i32, (i32, i32));
d = (1, (12, 13));

var e: i32;
e = d.1.0;  // == 12
Maps
Whamm provides maps for storage of key-value pairs.
This is similar to java’s Map and python’s dict types.
In fact, it is exactly Rust’s HashMap type…since Whamm leverages this Rust type under-the-hood!
Instantiation
// No need to instantiate a map, it is automatically created as an empty map.
var a: map<i32, i32>;
Reading and writing elements
Reading and writing elements of maps uses the [ ... ] syntax like maps in many other languages.
var a: map<i32, i32>;
a[0] = 3; // map write
var b: i32 = a[0]; // map read

// maps can also contain tuples!
var c: map<(i32, i32, i32), i32>;
c[(0, 0, 0)] = 3; // map write
var b: i32 = c[(0, 0, 0)]; // map read
Bounds and null checks
Accesses of Whamm maps are dynamically checked against the bounds.
var a: map<i32, i32>;
var b: i32 = a[0]; // produces Wasm trap through Rust
Functions
NOTE: This functionality hasn’t been fully implemented! More docs to come post-implementation!
Type Bounds
Some Wasm opcodes, such as local.set, have polymorphic arguments.
Users can further predicate matching such probe locations by type using type bounds.
For now, this also avoids needing to implement polymorphism in Whamm.
Necessitating users to create one type bound probe per potential type.
Here’s an example using type bounds:
wasm:opcode:call(arg0: i32):before {
    report unshared var all_arg0s: map<i32, i32>;
    all_arg0s[arg0]++;
}
report Variables
The report keyword specifies variables whose values should be flushed.
When monitoring an application execution, data describing observations should be stored in a report variable to make use of this flushing feature.
Using report is really shorthand for report unshared, see [unshared] variable documentation.
The default behavior of this “flush” is to print to the console (the core Whamm library uses WASI to do this).
This will be done at the end of program execution with the final values of the variables.
For example:
report var count;
wasm:opcode:call:before {
    // count the number of times the `call` opcode was used during the application's dynamic execution.
    // (a single global count)
    count++;
}
unshared Variables
If a variable is marked as unshared, an instance of this variable is made available to every match site for a probe.
The scope of this variable is limited to the specific match site.
The value of this variable will be stable on each entry into the probe’s logic, meaning that it will not be reinitialized each time.
This can be used to collect data at a specific program point over time.
For example:
wasm:opcode:call:before {
    // collect the number of times each `call` opcode is executed during dynamic execution.
    // (as many counts as there are `call` opcodes in the program)
    // This variable will not be reinitialized each time this probe's body is executed,
    // rather, it will be the value it was the last time it ran!
    unshared var count: i32;
    count++;

    // This variable will be reinitialized to 0 each time this probe's body is executed
    var local_variable: i32;
    local_variable++;
}
shared Variables
NOTE: This functionality hasn’t been fully implemented! More docs to come post-implementation!
If a variable is marked as shared, a single instance of this variable is available to every match site for a probe.
The scope of this variable is limited to all match sites of a probe.
The value of this variable will be stable on each entry into the probe’s logic, meaning that it will not be reinitialized each time.
This can be used to collect data for some probed event over time.
For example:
wasm:opcode:call:before {
    // collect the number of times the `call` opcode is executed during dynamic execution.
    // (a single count tied to the wasm:opcode:call event in the program)
    // This variable will not be reinitialized each time this probe's body is executed,
    // rather, it will be the value it was the last time it ran!
    shared var count: i32;
    count++;

    // This variable will be reinitialized to 0 each time this probe's body is executed
    var local_variable: i32;
    local_variable++;
}
Probes
<probe_rule> / <predicate> / { <actions> }
We use the term probe to refer to this triple of probe_rule, predicate and actions.
When performing bytecode rewriting, Whamm:
- traverses the application’s Wasm module to find the locations-of-interest as specified by each probe’s
probe_rule. - checks if the
predicateevaluates tofalsestatically- if it does evaluate to
falseit continues on, not injecting the probe’s actions - if it does not evaluate to
false, it injects the probe’s actions at that location along with the foldedpredicate.- if the
predicateevaluates totruestatically, it will simply inject the actions into the program un-predicated. - if the
predicatedoes not fold to a simplebooleanvalue, it will inject predicated actions into this location. The predicate will then be evaluated dynamically when the application runs to conditionally execute the probe actions.
- if the
- if it does evaluate to
Helpful info in CLI
whamm info --help
The info command provided by the CLI is a great resource to view what can be used as the probe match rule.
This command provides documentation describing the match rule parts as well as the bound variables and functions in scope, which can help users learn about how to build their instrumentation.
The Probe Match Rule
provider:package:event:mode
The probe_rule is a way to express some “location” you want to instrument for your program.
It is a hierarchical with respect to provider, package, event and `mode.
| part | description |
|---|---|
| provider | The name of the provider that supports this instrumentation capability used in this probe. |
| package | The name of the package within the specified provider that supports the instrumentation capability used in this probe. |
| event | The name of the event that would correlate with the location to insert this probe in the instrumented program. |
| mode | The name of the mode that should be used when emitting the probe actions at the event’s location, such as before, after, and alt. |
Each part of the probe_rule gradually increases in specificity until reaching the mode of your probe.
Consider the following example match rule: wasm:opcode:br_if:before.
This rule can be read as “Insert this probe before each of the br_if Wasm opcodes in my program.”
Read through our instrumentable events documentation for what we currently support and our future goals.
The Predicate
/ <predicate> /
The predicate is a way to express some “conditional” you want to evaluate to true for the probe’s actions to be executed.
It further constrains the match rule.
This aspect of a probe is optional to use.
If there is no predicate for some probe, the actions will always execute when the probe’s location is reached during program execution.
Constant Folding of Static Data
A probe can be predicated on both static AND dynamic data.
To support this, when targeting bytecode rewriting, the whamm compiler performs constant propagation for statically-defined data.
Meaning that since static information is known at compile time, the values of those variables will be substituted and expressions can be partially evaluated.
As an example, consider the following probe:
wasm:opcode:br_if:before / pc == 25 && arg0 == 1 / {..}
This can be read as, attach a probe at the wasm opcode br_if, but only execute this logic if both the pc is 25 and the arg0 evaluates to 1.
As we’re traversing an application, we statically know when we’re at the pc offset of 25 within a function.
BUT we don’t know the value of arg0 until the code is actually running!
This is where partial evaluation comes in.
Let’s say we’re at pc 0 within some function, constant propagation and partial evaluation would look like this:
0 == 25 && arg0 == 1
false && arg0 == 1
false
The predicate evaluated to false statically! This means we should not attach the probe at this location, it’s not a match!
Let’s say we’re at pc 25 within some function:
25 == 25 && arg0 == 1
true && arg0 == 1
arg0 == 1
Huh…we still have a part of the predicate left over! What should we do… We still need to predicate on this part of the expression, we just need to inject this partially-evaluated expression to run at runtime! So, we’d inject the probe body, wrapped with this condition!
Note that this does look a bit different for the wei target, Whamm has to do some other tinkering with the predicate there, which enables the engine to run the correct part of the predicate at the correct time (match time vs. runtime).
The Actions
{ <actions> }
The actions are statements that are executed at the probe_rule’s location if the predicate evaluates to true.
Probe Injection Ordering
When multiple probes match the same bytecode location, whamm guarantees their injection order under two rules:
Rule 1: Same probe category — script order is preserved
Two probes in the same injection category (e.g., both opcode:call:before, or both func:entry) are always injected in the order they appear in the script.
// order0.mm — func:entry fires first, then the second func:entry
wasm:func:entry { /* A */ }
wasm:func:entry { /* B */ }
// at any function entry: A runs, then B runs
This guarantee holds across multiple scripts passed to the compiler: probes from the first script are injected before probes from the second.
Rule 2: Different probe categories — order is determined by the injection target
When two probes belong to different injection categories (e.g., wasm:opcode:call:before vs. wasm:func:entry), their relative order at a shared location is not controlled by script order.
The bytecode rewriting target (wirm) uses a two-pass injection model:
- Pass 1 (normal):
before,after, andaltprobes are injected during the bytecode traversal pass. - Pass 2 (special modes):
func:entry,func:exit,block:entry,block:exit, and similar structural probes are resolved and injected at encode time.
Because these two passes are independent, a before probe will always be injected before a func:entry probe at the same bytecode location (the first instruction of a function), regardless of which appears first in the script.
If you need a specific ordering between probes of different categories, place all of your logic in one probe at the more specific event (e.g., opcode:call:before rather than a mix of func:entry and opcode:call:before at the same location).
Whamm Scripts
Instrumentation (aka a monitor) is expressed as a set of predicated probes in a script with the .mm extension.
Here is a high-level view of the grammar for a Whamm script:
// Statements to initialize the global state of the instrumentation
global_statements;
...

// Function definitions to reuse code snippets
fn_name(fn_args) -> ret_val { fn_body; ... }
...

// An example of what a `probe` would look.
// There can be many of these in a monitor.
provider:package:event:mode / predicate / {
  probe_actions;
  ...
}
Instrumenting with the CLI
whamm instr --help
The instr command provided by the CLI enables developers to actually instrument programs.
Instrumentable Events
Currently available packages:
wasm:opcode: to instrument Wasm opcodeswasm:func: to instrument Wasm functions- currently supports
entryandexit - future:
unwind
- currently supports
wasm:block: to instrument Wasm basic blocks
Packages to be added:
threadoperation eventsgcoperation eventsmemoryaccess (read/write) eventstableaccess (read/write) events- WASI
componentoperation events, e.g.wasi:http:send_req:alt wasm:begin/wasm:endeventstrapsexceptionthrow/rethrow/catch events
Libraries
Libraries are used to define instrumentation behavior when it goes beyond the scope of the core DSL grammar.
In fact, Whamm itself depends on the Whamm core library, named whamm_core.wasm, to provide printing support and a map implementation.
Building and using custom libraries
To build your own custom library:
- Design your API in a way that can be interacted with using basic Wasm primitives (e.g. i32, f32, etc.). Note that Whamm does not currently support libraries that return multiple results.
- Write your library in a language that compiles to Wasm.
Make sure that the API functions are exported using filenames that are compatible with the
WhammDSL keywords. - Compile your library to Wasm.
- Inspect your library function exports using
wasm-tools.
Now that you have a library binary, you can use the library in your Whamm script.
To do so, you will import the library into your script with the use keyword.
At that point, the library can then be called using the syntax: lib_name.func_name().
Here’s an example script using a Whamm library (it also gets around Whamm not supporting returning multiple results via bit-packing):
// import the library that simulates a cache
use cache;

// instrument all load and store opcodes
wasm:opcode:*load*|*store*:before {
    report unshared var hit: u32;
    report unshared var miss: u32;

    // call the library `check_access` function and pass bound variables as parameters
    var result: i32 = cache.check_access(effective_addr as i32, data_size as i32);
    var num_hits: i32 = (result & 0xFFFF0000) >> 16;
    var num_misses: i32 = (result & 0x0000FFFF);

    hit = hit + (num_hits as u32);
    miss = miss + (num_misses as u32);
}
Using Libraries at Init Time
There may be some libraries that require initialization with some state at the start of program execution.
This can be accomplished by simply adding the @init annotation to such a call.
If a library call is tagged as @init in a probe-local scope, the call is guaranteed to be performed at
probe initialization time (this time is dependent on the backend target, wei or rewriting).
While library calls in the global scope of a script are always guaranteed to be performed in the start function
of a program, users can still tag them with @init to more explicitly demonstrate this guarantee in a script.
use toggle;

// both of the following will run in a program's start function
@init toggle.get_value();
toggle.get_value();

wasm:opcode:*:before {
    // will run at probe initialization time
    // rewriting: in the program's start function
    // wei: in the probe's initialization function callback
    @init toggle.get_value();
}
Using Libraries at Match Time
Libraries can even be used to extend the match-time capabilities of the Whamm DSL.
This is done by simply adding the @static annotation to such a call.
NOTE: These calls must not have side-effects that are required to persist to dynamic execution.
Such side effects will persist on wei, but in bytecode rewriting, the state is lost.
We plan to support persistent state for rewriting in the future, see: ideas/@static-serialize.md.
Why is this useful?
Let’s say you want to instrument the i32.load who’s result is eventually used by a specific br_table.
You cannot express that with the current match rule capabilities of Whamm.
In fact, this specific situation requires abstract interpretation!
To offload such complexity, match-time decisions can leverage libraries to find such points.
Further, in bytecode rewriting, such libraries can be used to pull constants and reduce emitted code through constant propagation.
This constant propagation can even reduce if/else switches!
Consider the following example script that can be used for gas instrumentation:
use gas;
use analysis;

TINIT = 0;
TFILL = 0;
TCOPY = 0;

MINIT = 0;
MFILL = 0;
MCOPY = 0;

// Probes for GAS usage

wasm:opcode:*:before / @static analysis.should_inject(fid, pc) && ! @static analysis.linear_cost_at(fid, pc) == 0 / {
    var constant_cost: i32 = @static analysis.constant_cost_at(fid, pc);

    switch (@static analysis.instr_kind(fid, pc)) {
        case CONST => gas.decr_const(constant_cost);
        default => unreachable();
    }
}
wasm:opcode:*(arg0: i32):before / @static analysis.should_inject(fid, pc) && @static analysis.linear_cost_at(fid, pc) > 0  / {
    var linear_cost: i32 = @static analysis.linear_cost_at(fid, pc);
    var constant_cost: i32 = @static analysis.constant_cost_at(fid, pc);
    switch (@static analysis.instr_kind(fid, pc)) {
        case TINIT => gas.finite_wasm_table_init(arg0, linear_cost, constant_cost);
        case TFILL => gas.finite_wasm_table_fill(arg0, linear_cost, constant_cost);
        case TCOPY => gas.finite_wasm_table_copy(arg0, linear_cost, constant_cost);

        case MINIT => gas.finite_wasm_memory_init(arg0, linear_cost, constant_cost);
        case MFILL => gas.finite_wasm_memory_fill(arg0, linear_cost, constant_cost);
        case MCOPY => gas.finite_wasm_memory_copy(arg0, linear_cost, constant_cost);

        default => unreachable();
    }
}
How does this work?
In bytecode rewriting, we embed wasmtime to call such libraries as the backend visits the target application bytecode.
Each module that is called statically is instantiated, the instance and state are held by the WasmRegistry.
This registry is defined in src/lang_features/libraries/registry.rs.
In wei, these calls are simply performed at the engine match time.
This guarantees that any state that should be persisted between match and runtime remains.
This also requires that running a wei monitor module that has been generated from a script containing @static calls to a library is linked at runtime.
This is not required for bytecode rewriting since those @static calls have already been made (thus not requiring the Wasm imports to that library).
Testing Your Instrumentation
NOTE: This functionality hasn’t been fully implemented! More docs to come post-implementation! This is a future research goal of ours.
Injection Strategies
Debugging and profiling programs are an integral part of engineering software. This is done through instrumenting the program under observation (inserting instructions that provide insight into dynamic execution).
The most-common instrumentation techniques, such as bytecode rewriting, inject instructions directly into the application code. While this method enables instrumentation to support any application domain, it intrudes on the program state space (possibly introducing bugs), complicates the implementation, limits the scope of observation, and cannot dynamically adapt to program behavior.
Instead, one can remedy these issues with bytecode rewriting by interfacing with a runtime engine that directly supports instrumentation. This technique can bring powerful capabilities into play as demonstrated by the Wizard research engine, in the ASPLOS paper Flexible Non-intrusive Dynamic Instrumentation for WebAssembly. This paper demonstrated how to build instrumentation support that protects the application-under-observation, provides consistency guarantees to enable composable tooling, applies JIT optimizations specific to instrumentation that make some tools run even faster than bytecode rewriting, and more. However, this technique is not as widely-used as bytecode rewriting since it limits a tool’s scope to applications that can run on such engines.
This is where Whamm comes in.
This DSL abstracts above the instrumentation technique to enable developer tooling to support a broad domain of applications while leveraging runtime capabilities as-available without reimplementation.
With Whamm you can write instrumentation once and support wide domain of apps.
Use engine instrumentation capabilities as available.
Use bytecode rewriting to support everything else.
Bytecode Rewriting
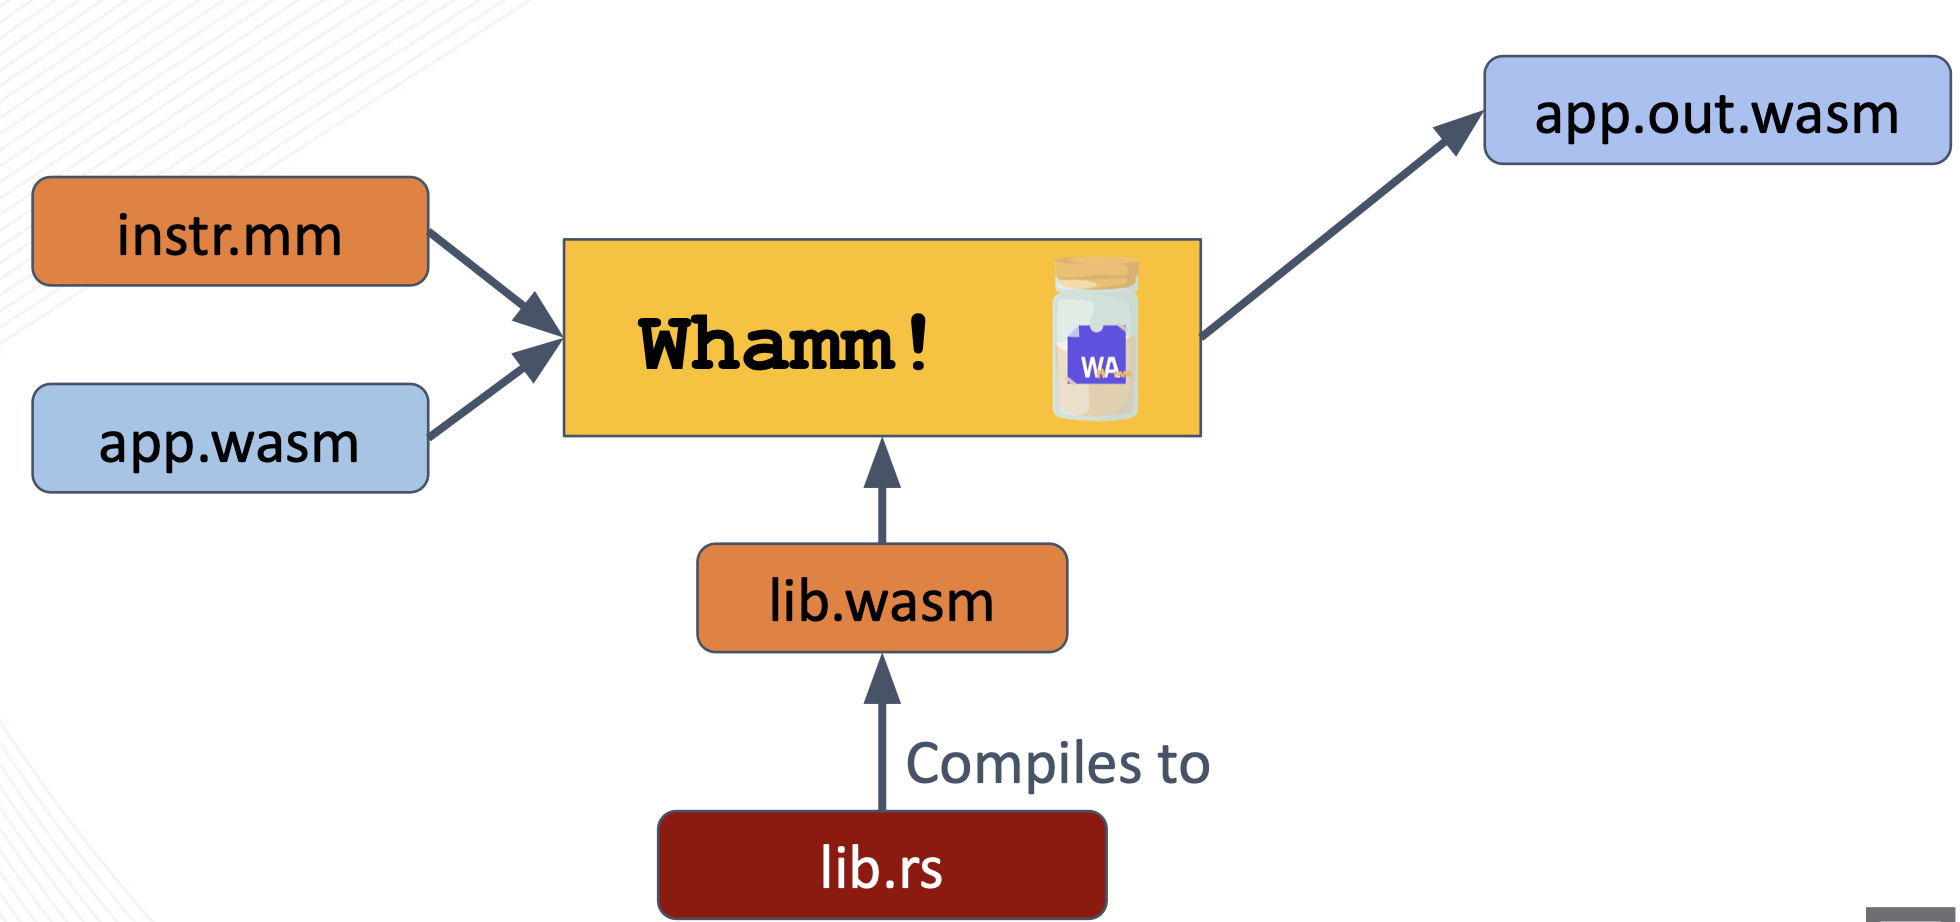
When this strategy is used, the target application bytecode must also be provided to the Whamm compiler.
To perform the bytecode rewriting injection strategy, Whamm leverages the wirm Rust library.
This library loads the app.wasm module into an AST representation that can then be traversed and manipulated to directly inject the instrumentation into the application’s bytecode.
Read more about the low-level details in the developers documentation.
The now-instrumented application is output as a new Wasm module, as shown above (app.out.wasm).
Direct Engine Support (wei)##
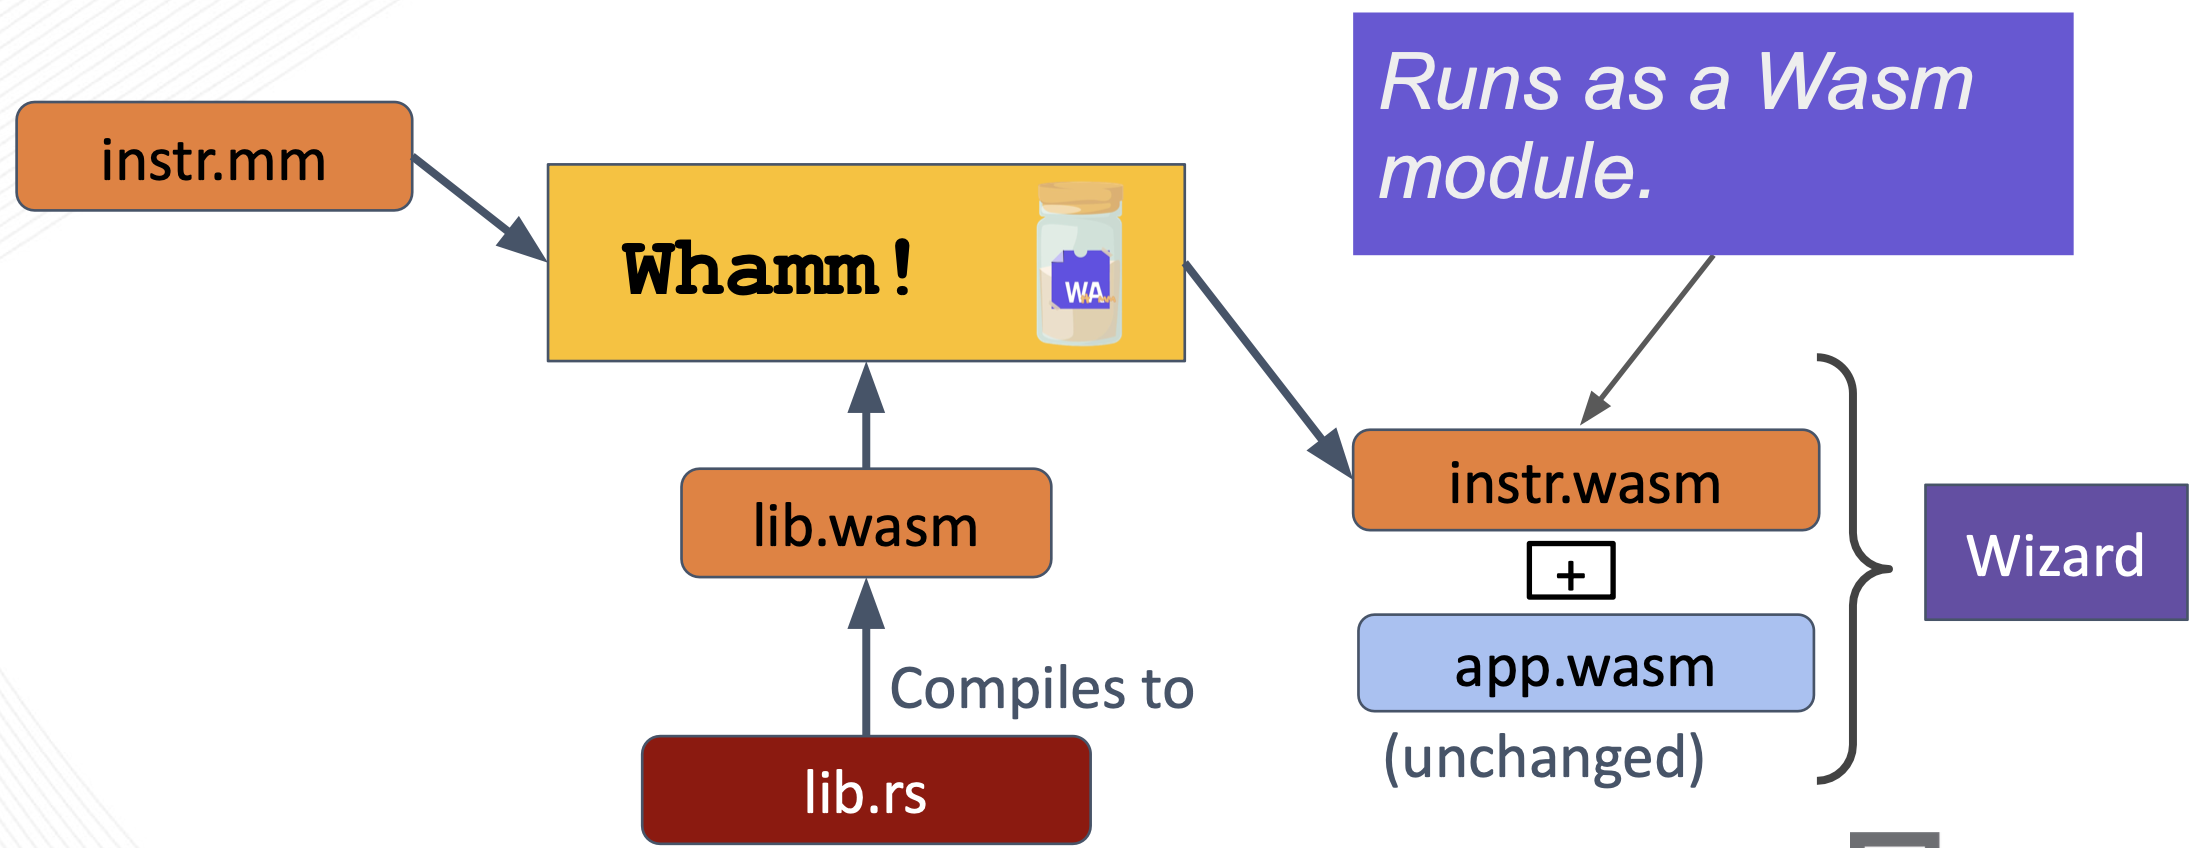
Users may also target an engine that directly supports instrumentation via the interface used by Whamm.
Currently, the only Wasm engine that does this is Wizard.
You can read about Wizard’s instrumentation capabilities in the ASPLOS paper: Flexible Non-intrusive Dynamic Instrumentation for WebAssembly.
The Whamm compiler generates a Wasm module that encodes instrumentation in a generic way, it is not directly tied to an application’s bytecode.
Read the developer’s Engine Target documentation for more information on how this works if interested.
Note, when using this strategy, the target application’s bytecode is not provided to the Whamm compiler.
This is because the engine finds the appropriate instrumentation injection points in the application and attaches the appropriate callbacks at application runtime.
Thus, the app.wasm is provided as a “co-module” (meaning a Wasm module that is directly connected to its supporting instr.wasm) to the engine at runtime.
Examples
Here are some documented examples of probes written in the language.
Branch Monitor
Here is an example monitor that can be written in Whamm, it does not require an instrumentation library.
Rather, it uses the DSL to express all of its monitoring logic.
// Matches _if and br_if events
wasm::*if:before {
  report unshared var taken: i32;
  report unshared var total: i32;

  // which branch was taken?
  var was_taken: bool = arg0 != 0;
  taken = taken + (was_taken as i32);
  total++;
}

wasm::br_table:before {
  report unshared var taken_branches: map<u32, u32>;

  // which branch was taken?
  // default branch is at 'num_targets' in the map
  var index: u32 = arg0 <= (num_targets - 1) ? arg0 : num_targets;

  // count stores an array of counters
  taken_branches[index]++;
}

wasm::select(arg0: i32):before {
  report unshared var selected_first: u32;
  report unshared var total: u32;

  // which branch was taken?
  var was_taken: bool = arg0 != 0;
  selected_first = selected_first + (was_taken as u32);
  total++;
}
Cache Simulator
Here is an example monitor that can be written in Whamm, it calls a provided cache implementation to simulate cache lookups on memory operations.
// CacheSim: instruments memory accesses and simulates a cache attached to the memory.

use cache;

wasm:opcode:*load*|*store*:before {
    report var hit: u32;
    report var miss: u32;

    var result: i32 = cache.check_access(effective_addr as i32, data_size as i32);
    var num_hits: i32 = (result & 0xFFFF0000) >> 16;
    var num_misses: i32 = (result & 0x0000FFFF);

    hit = hit + (num_hits as u32);
    miss = miss + (num_misses as u32);
}
Call Graph
Here is an example monitor that can be written in Whamm.
It builds a call graph of the direct and indirect calls.
use whamm_core;

// (from, to) -> count
report var call_graph: map<(u32, u32), u32>;
var tracking_target: bool;
var caller: u32;

wasm:opcode:call|return_call:before {
    call_graph[(fid, imm0)]++;
}

wasm:opcode:*call_indirect|*call_ref:before {
    tracking_target = true;
    caller = fid;
}

wasm:func:entry {
    if (tracking_target) {
        call_graph[(caller, fid)]++;
        tracking_target = false;
    }
}

wasm:report {
    // this is the ID of the map above...need to make this less hard-coded.
    // maybe: `call_graph.id()`
    whamm_core.print_map_as_csv(0);
}
For Whamm Developers
Do you want to contribute to Whamm or just learn about the low-level details for fun?
Then you’re in the right place.
Resources
Parsing:
- The Pest book
Whamm Implementation Concepts
The four phases of compilation:
Other helpful concepts:
- The
WhammCLI - Testing
- Error Handling
The Four Phases of Compilation
First, what is meant by the term “compilation” depends on the selected injection strategy.
For bytecode rewriting, compilation means generating a new instrumented variation of the application’s bytecode.
For direct engine support, compilation means compiling the .mm script to a new Wasm module that interfaces with an engine to instrument the program dynamically.
The original program is not touched and not provided when using this strategy.
The first three phases of Whamm compilation are identical for both strategies.
The translate and emit phases vary between injection strategy.
This is because “emitting” for bytecode rewriting means using the wirm library to insert new instructions into the program.
Whereas “emitting” for direct engine support means emitting a Wasm module encoding where to instrument and the callbacks to attach at the probed sites by interfacing with the engine at application runtime.
These are the four phases of compilation:
Phase 1: Parse
Here is documentation describing how we parse .mm scripts.
The Grammar
Whamm’s grammar is written using the Pest parser generator Rust library, which uses Parsing Expression Grammars (PEG) as input.
Reading the Pest book first will inform how to read the whamm.pest grammar.
Pest parses a passed .mm script and creates a set of matched Rules that are then traversed in the whamm_parser.rs to generate Whamm’s Abstract Syntax Tree (AST).
These Rules correspond to the naming used in the whamm.pest grammar.
The logic for creating the AST from the Pest Rules can be followed by starting at the parsing entrypoint: the parse_script function found in the whamm_parser.rs file.
The Abstract Syntax Tree (AST)
We use an AST to represent the .mm script after parsing.
This AST is leveraged in different ways for each of the subsequent compiler phases.
During verification, the AST is used to build the SymbolTable and perform type checking.
While transforming the AST into the injection strategy’s representation, the AST is visited and restructured in a way that is simpler to compile for each strategy. Each node contains new data unique to each strategy that is helpful while emitting.
While emitting, the simpler AST variation mentioned above is used to lookup global statements and iterate over probe definitions to inject them into locations-of-interest in the Wasm program.
Phase 2: Verify
Here is documentation describing how we verify .mm scripts.
The SymbolTable
During verification, first the SymbolTable is build from the AST.
There are great resources online that teach about symbol tables if that is helpful for any readers.
At a high-level, the SymbolTable stores metadata about source code symbols.
For .mm scripts, symbols can be parts of the probe match rule (e.g. provider, package, event, and mode), function names, and variables (local or global).
The enum named Record in the verifier/types.rs file defines these symbols and the metadata-of-interest for each of them.
The metadata-of-interest tends to be type information and addressing that corresponds to the ID assigned to the symbol after it’s been emitted into the Wasm program.
Type information is used when type checking the script and when emitting the instrumentation (to know the type of each item being emitted).
An example of when the addressing metadata is used is emitting and calling functions.
After a function defined by the instrumentation has been injected, the ID for this function would need to be stored in the SymbolTable to be looked up and used when there a call to the function is being emitted at some future point (see the InitGenerator documentation).
These symbols are contained within some scope.
The types of scopes present in a .mm script can be found in the enum named ScopeType in the verifier/types.rs file.
The concept of scopes in this context is the same as in other programming languages.
A scope defines where variables and functions are accessible based on their location in a program.
In the context of Whamm there are some scopes that exist but aren’t accessible to the end-user.
Consider the probe match rule: provider:package:event:mode.
Each part of this match rule really has its own scope.
This enables each part to introduce its own helpful bound variables and functions that the user can leverage to write more expressive instrumentation!
These bound variables and functions are added to the AST in the whamm_parser.rs file by calling the get_matches function of provider_handler.rs.
See the probes syntax documentation for a helpful CLI tool that enables the user to see what is in-scope for any given probe match rule.
See the extending providers documentation for how you can extend the providers and their bound functions/variables.
Problems / Workarounds
1. Ownership of Records and Scopes.
When writing the SymbolTable structure, there were issues with pushing the ownership of Records and Scopes down into each parent.
The workaround was to hold a Vec of all Records and Scopes for the entire program in the SymbolTable struct, then hold usize types that indexes into these Vecs in the Records and Scopes.
It is possible that this could be avoided by just boxing the values in the Records and Scopes, but some experimentation needs to be done.
Building the SymbolTable
The builder_visitor.rs file builds the SymbolTable from the script’s AST.
The visit_whamm function is the entrypoint for this behavior.
This follows the visitor software design pattern.
There are great resources online that teach about the visitor pattern if that is helpful for any readers.
The TypeChecker
The type checker then visits the AST and uses the SymbolTable to verify that variable usage is appropriate.
It can find out-of-scope usages, invalid method invocations, misused types, etc.
Phase 3: Transforming the AST
This is done by first collecting metadata about each probe in an AST traversal via the MetadataCollector.
This collector tracks the following (this list may extend in the future):
- The user library functions that were actually used in a script.
- The bound functions that were actually used in a script.
- Each data type that will need to be flushed at report time.
- The strings that are necessary to exist for the script to work.
- Whether any probe has state that needs to be initialized.
All of this state tracking helps emit better code in the compiler backend.
It also summarizes the statically and dynamically bound variables for each probe.
This list is used in bytecode rewriting to define the necessary static data at compile time and to emit the necessary code to define dynamic data at runtime.
For the wei backend, each of these bound variables is requested from the engine so that the engine passes their value to the probe, or predicate, callback function.
When bytecode rewriting, the AST resulting from the metadata collection step is then translated into a SimpleAst.
Phase 5: Emit
Here is documentation describing how we emit .mm scripts.
Some Helpful Concepts
What is a generator?
A generator is used to traverse some representation of logic in an abstract way.
It then calls the emitter when appropriate to actually emit the code in the target representation.
What is an emitter?
The emitter exposes an API that can be called to emit code in the target representation.
There will be as many emitters as there are target representations supported by the language.
The Injection Strategies
The code that is emitted, and the methodology in which emitting happens, depends on the injection strategy specified by the user.
There are currently two supported injection strategies:
- Bytecode Rewriting
- Interfacing with an engine
Bytecode Rewriting
For bytecode rewriting, there are two generators.
Each of these generators are used for a specific reason while emitting instrumentation.
The InitGenerator is run first to emit the parts of the .mm script that need to exist before any probe actions are emitted, such as functions and global state.
The InstrGenerator is run second to emit the probes while visiting the app.wasm bytecode (represented as an in-memory IR).
Both of these generators use the emitter that emits Wasm code.
The emitter uses utilities that centralize the Wasm emitting logic found at utils.rs
1. InitGenerator
The init_generator.rs traverses the AST to emit functions and variables that need to exist before emitting probes.
The run function is the entrypoint for this generator.
This follows the visitor software design pattern.
There are great resources online that teach about the visitor pattern if that is helpful for any readers.
This generator emits new Wasm functions and variables into the program with associated Wasm IDs.
These IDs are stored in the SymbolTable for use while running the InstrGenerator.
When emitting an instruction that either calls an emitted function or does some operation with an emitted global, the name of that symbol is looked up in the SymbolTable to then use the saved ID in the emitted instruction.
2. InstrGenerator
The instr_generator.rs calls into the emitter to gradually traverse the application in search for the locations that correspond to probe events in the .mm’s AST.
When a probed location is found, the generator emits Wasm code into the application at that point through emitter utilities.
Probe Injection Ordering
When multiple probes match the same bytecode location, the injection order is determined by two independent factors.
Same injection category: script order
Probes in the same injection category (e.g., two opcode:call:before probes, or two func:entry probes) are injected in the order they appear in the script.
This is enforced by using IndexMap instead of HashMap at every level of the probe hierarchy — Provider.packages, Package.events, Event.probes in provider_handler.rs, and the corresponding SimpleProv.pkgs, SimplePkg.evts, SimpleEvt.modes in simple_ast.rs.
IndexMap preserves insertion order, which equals the order probes are parsed from the script.
If plain HashMap were used instead, the iteration order would be non-deterministic, silently breaking the ordering guarantee.
Different injection categories: wirm’s two-pass model
wirm (the underlying Wasm IR library) uses a two-pass injection model:
- Pass 1 — normal modes (
before,after,alt): injected during the bytecode traversal, by callingapp_iter.before()/.after()/.alternate(). - Pass 2 — special/structural modes (
func_entry,func_exit,block_entry,block_exit, branching targets, etc.): resolved and injected at encode time by wirm’s own second pass.
The two passes are independent; wirm merges their results at encode time with pass-1 probes preceding pass-2 probes at the same instruction.
This means the relative order between a wasm:opcode:call:before probe and a wasm:func:entry probe at the same location (e.g., a call that is also the first instruction of a function) is fixed by wirm, not by script order:
before probes always execute before func_entry probes at that location.
See probe_mode_for_package in instr_generator.rs for where whamm maps probe rules to their wirm mode.
Constant Propagation and Folding!!
Constant propagation and folding are a compiler optimizations that serve a special purpose in Whamm.
There are lots of resources online explaining these concepts if that would be useful to the reader.
The whamm info command helps users see various variables that are in scope when using various probe match rules.
All of these global variables are defined by Whamm’s compiler and should only be emitted as constant literals.
If the variable were ever directly emitted into an instrumented program, with no compiler-provided definition, the program would fail to execute since the variable would not be defined.
Whamm uses constant propagation and folding to remedy this situation!
The define function in visiting_emitter.rs is how compiler constants are defined while traversing the application bytecode.
These specific variables are defined in the emitter since their definitions are tied to locations in the Wasm program being instrumented.
The ExprFolder in folding.rs performs constant propagation and folding on expressions.
When considering a predicated probe, this behavior can be quite interesting. Take the following probe definition for example:
wasm:bytecode:call:alt /
    target_fn_type == "import" &&
    target_imp_module == "ic0" &&
    target_fn_name == "call_perform"
/ { ... }
All three of the bound variables used in the predicate are statically defined by the compiler and are provided by the call event.
This means that all of these variable uses will be replaced by constants and the predicate will fold to a true or false.
If the predicate folds to true, the probe actions can be emitted at the found location without condition.
If the predicate folds to false, the probe should not be emitted.
Now, take the next probe definition example:
wasm:bytecode:call:alt /
    target_fn_type == "import" &&
    target_imp_module == "ic0" &&
    target_fn_name == "call_new" &&
    strcmp((arg0, arg1), "bookings") &&
    strcmp((arg2, arg3), "record")
/ { ... }
The predicate of this probe now includes both variables that are defined statically and variables that are defined dynamically, which is totally valid semantically!
So, what happens here?
The first three bound variables will be propagated away to constants, the expression will be folded, and those constant equivalence checks will evaluate to either true or false.
This reduced value will then be and-ed together with the following dynamically-defined portion of the expression.
So, the same goal will be accomplished here as in the previous example (the probe either will or will not be emitted at that bytecode location based on statically determined information).
However, this time the actions emitted will retain a conditional, but it will be the folded conditional that only includes the dynamic portion of the original predicate.
Pretty cool, right??
The Whamm Engine Interface (wei)
For wei, there is one generator named WeiGenerator in generator/mod.rs.
This generator visits the MetadataCollector’s AST and emits a self-contained, portable monitor against wei.
This generators uses the emitter that emits Wasm code.
The emitter uses utilities that centralize the Wasm emitting logic found at utils.rs
The WeiGenerator
The generator traverses the AST to emit functions and variables that need to exist before emitting probes.
The run function is the entrypoint for this generator.
This follows the visitor software design pattern.
There are great resources online that teach about the visitor pattern if that is helpful for any readers.
This generator emits new Wasm functions and variables into the program with associated Wasm IDs.
These IDs are stored in the SymbolTable for use while running the InstrGenerator.
When emitting an instruction that either calls an emitted function or does some operation with an emitted global, the name of that symbol is looked up in the SymbolTable to then use the saved ID in the emitted instruction.
Remember that when targeting wei, Whamm does not have access to the application during compilation.
Rather, Whamm must encode requests for application state via the interface.
The generator encodes these requests in Wasm function export names.
The requested state is then passed by the engine to the monitor via function arguments.
wei exports
Probe predicates and bodies are compiled to Wasm and leveraged as callbacks to the engine. The engine is made aware of these special functions through encoding metadata in their export names. This metadata follows a simple grammar:
⟨export-name⟩   ::=     ⟨match-rule⟩⟨predicate⟩? ⟨params⟩?
⟨match-rule⟩    ::=     'wasm':'opcode':('OPCODE'|'*')
                        'wasm':'func':('entry'|'exit')
                        'wasm':'block':('start'|'end')
                        'wasm':'exit'
⟨predicate⟩     ::=     ‘/’ ⟨call⟩‘/’
⟨call⟩          ::=     ‘$’ ID ⟨params⟩?
⟨params⟩        ::=     ‘(’ ‘)’
                        | ‘(’ ⟨param⟩( ‘,’ ⟨param⟩)* ‘)’
⟨param⟩         ::=     ‘argN’ | ‘immN’ | ‘localN’ | ⟨call⟩| ‘pc’ | ‘fid’ | ‘frame’
The engine will identify these special, exported functions and find their respective match locations in the target application. If the match is further predicated, it will call the exported predicate function and pass its requested data. If the predicate evaluates to true (non-zero response), the probe is dynamically inserted at that application location. If the predicate evaluates to false (zero response), the probe is not inserted at that location.
Many bound variables must be requested from the engine explicitly.
However, some variables are derived from other bound variables, these request the data that they are derived from to keep the engine from supporting more and more state.
For example, the effective_addr for a load is derived by adding arg0 and offset.
So, the compiler will simply request arg0 and the static offset state, then derive the effective_addr through adding the two.
Here is an example probe function export:
(export "wasm:opcode:array.new / $20(is_func_end, opname) / ($21(fname), fid, pc)" (func 22))
Seeing this, the engine will find all array.new opcodes in a target application.
It will evaluate the predicate function, exported with the name “$20”, and pass the is_func_end, and op_name state.
If it evaluates to true, the engine would then execute “$21” function, passing the requested state and remember this function’s results.
The probe will be attached to this array.new location and the engine will pass the result of the execution of “$21” as well as fid, and pc, in that order.
There are many optimizations that the engine can perform to make the instrumentation run fast when using wei.
These optimizations are discussed in this paper: https://doi.org/10.1145/3763124
You might also notice that wei does not support general glob matching.
To keep from engines needing to implement this feature, Whamm expands globs to their lowest event match.
Overlapping probes
Multiple probes in a script may target the same event (e.g. two wasm:opcode:call:before probes).
For bytecode rewriting this is fine — each probe’s body is injected independently at the call site.
For wei, however, each exported probe function is identified by its export name.
If two probes would produce the same export name, the engine would see duplicate exports and the behavior is undefined.
To handle this, WeiGenerator merges probes with identical export-name signatures before emitting.
The merge key encodes everything that determines the export name shape:
- The rule string (e.g.
wasm:opcode:call:before) - The body function parameter types — derived from
metadata.body_args; probes that request different application state (e.g. differentlocalNtype bounds or different engine variables) produce different body signatures and are therefore kept separate - The predicate function parameter types — from
metadata.pred_args; only included when a separate predicate function would be emitted (static, non-dynamic predicate) - The init/alloc function parameter types — from
metadata.init_args - Whether an alloc function is present (i.e. the probe has unshared variables)
- The number of static library call functions
Two probes whose keys match are merged into a single probe whose body is the concatenation of both bodies.
If a component probe carries a predicate, its body is wrapped as if <pred> { <body> } so the predicate is evaluated at runtime inside the merged function rather than as a separate pre-check export.
This makes all inlined predicates “dynamic” in the sense that they are checked inside the body, not exported as a separate predicate function.
Additional bookkeeping performed during the merge:
@staticalias remapping — each probe’s@staticNvariable references are renumbered by the offset of that probe’s static library calls in the merged list (e.g. probe B’s@static0becomes@static2if probe A contributed 2 static calls).- Unshared variable deconfliction — if two probes declare an unshared variable with the same name, the later probe’s variable is renamed with a numeric suffix (
foo→foo_1, etc.) and all references in its body and init logic are rewritten accordingly.
The Whamm CLI
The CLI is defined using the clap Rust crate.
Extending Provider Definitions
(This is rather tedious at the moment. We plan to change the way this is done in the future.)
Whamm providers are defined via .yaml files located in the providers/ folder.
They are processed by the provider_handler.rs to find matching events based on probe match rules.
The reason this is so tedious is that all .yaml files supplied to Whamm are concatenated into one giant .yaml file to be compatible with Rust’s yaml parsing library.
Further, this library has a bug when handling yaml anchors, which makes what we have to write very redundant.
Since this library has been recently archived, we’ve really got to move to something more stable.
Anyway, to extend what we have at the moment, you can simply edit the files you find in the providers/ folder.
To test your changes, use the whamm info utility, it should be able to show you changes immediately.
If you get an error during parsing the yaml, there’s something wrong with your changes.
Further, remember that the whamm CLI supports re-routing where it looks for the providers/ folder.
To do so, use the --defs-path option.
Binding the data for Rewriting
If you’re wanting to support your provider changes in the rewriting backend of Whamm, you’ll need to define what the state actually is in the compiler.
All of this is managed in emitter/rewriting/rules/mod.rs.
This file matches on the probe match rule (e.g. “wasm:opcode:call:before”) and then takes a look at what application state the probe needs to work.
It then defines this state and allows the compiler to continue on with its probe insertions.
Provider Defs + wei = Awesome
This functionality can even let you define totally new providers for Whamm, letting you instrument anything with Wasm code!
Maybe you want to instrument linux syscalls with Wasm instrumentation (look out eBPF).
To do this, you would need to create provider definitions for this and then create something that supports wei.
This wei thing would do the same thing a Wasm engine does on your monitor module, finding relevant exported functions, performing predication, and remembering the state to pass on callback invocation.
Then it would need to somehow insert logic into the kernel that calls the callbacks and passes the relevant state to the Wasm module.
This really lets you instrument anything with Wasm using a simple, extensible interface: wei.
The .wast Test Harness
A .wast file is used for testing purposes and simplifies the writing of tests for developers.
We use .wast files to encode assertions that should pass when running an instrumented variation of a wasm module.
Writing .wast Tests
The high level structure looks like this:
<module_in_wat>

;; WHAMM --> <some_oneline_whamm_script>
<whamm0_assertion0> ;; The first assertion for the first whamm script
<whamm0_assertion1> ;; The second assertion for the first whamm script

;; WHAMM --> <some_oneline_whamm_script>
<whamm1_assertion0> ;; The first assertion for the second whamm script
<whamm1_assertion1> ;; The second assertion for the second whamm script
<whamm2_assertion1> ;; The third assertion for the second whamm script
The module encoded in the script above would be used for all the following whamm/assertion groups.
To verify that all assertions fail before instrumenting, 5 new .wast files would be generated with the original module and run on the configured interpreters.
To verify that all assertions pass after instrumenting, 2 new .wast files would be generated, one per specified whamm script, including the assertions under the respective whamm script.
Below is an example .wast test:
;; Test `wasm:opcode:call` event

;; @instrument
(module
    ;; Auxiliary definitions
    (func $other (param i32) (result i32) (local.get 1))
    (func $dummy (param i32) (result i32) (local.get 0))

    ;; Test case functions
    (func (export "instrument_me") (result i32)
        (call $dummy (i32.const 0))
    )
)

;; WHAMM --> wasm:opcode:call:before { arg0 = 1; }
(assert_return (invoke "instrument_me") (i32.const 1)) ;; will be run with the above WHAMM instrumentation

;; WHAMM --> wasm:opcode:call:alt { alt_call_by_name("other"); }
(assert_return (invoke "instrument_me") (i32.const 1)) ;; will be run with the above WHAMM instrumentation
Below is an example .wast test using imports:
(module
    (func (export "dummy") (param i32) (result i32)
        local.get 0
    )
)

(register "test")

;; @instrument
(module
    ;; Imports
    (type (;0;) (func (param i32) (result i32)))
    (import "test" "dummy" (func $dummy (type 0)))

    ;; Globals
    (global $var (mut i32) (i32.const 0))

    ;; Global getters
    (func $get_global_var (result i32)
        (global.get $var)
    )

    ;; Test case functions
    (func $foo
        (call $dummy (i32.const 0))
        global.set $var
    )

    (start $foo)
    (export "foo" (func $foo))
    (export "get_global_var" (func $get_global_var))
    (memory (;0;) 1)
 )

;; WHAMM --> var count: i32; wasm:opcode:call:alt / arg0 == 0 / { count = 5; return 1; }
(assert_return (invoke "get_global_var") (i32.const 1)) ;; alt, so global should be return value
(assert_return (invoke "get_count") (i32.const 5))
There are several conventions to follow when writing .wast test cases for whamm.
- Only one
module-to-instrument per.wastfile.- The test setup goes at the top (which can include multiple modules when considering testing imports).
- The
module-to-instrument is the final part of the setup and is marked by;; @instrumentabove the module.
- Use comment to specify the
Whammscript, syntax:;; WHAMM --> <whamm_script>- The scripts are run on the
modulein the.wastfile. - If there are multiple
assertsunder aWhammcomment, they are all run against the instrumented variation of themodulethat results from thatWhammscript.
- The scripts are run on the
- All asserts should fail if they were to run without instrumentation.
NOTE: For wei, don’t do manipulations that change arg* (that requires the frame accessor). Instead change global state for now?
The Harness Code
The harness is located in tests/common/wast_harness.rs with the main function as the entrypoint.
We invoke this harness through calling the main entrypoint in the run_wast_tests test case located in tests/integration_test.rs.
One can read the harness code and see that it performs the following logic:
- Split out test components of each
.wastfile found undertests/wast_suiteas an individualWastTestCase- a
wasmmodule - a
whammscript - a list of assertions that should be true post-instrumentation
- a
- Ensure all assertions fail before instrumenting with
whamm. We do this to be able to claim that correctness of instrumentation was the sole purpose that some test passed. We ensure that this property holds by first creating new.wastfiles with one assertion per file and making sure that they fail when run on a supported interpreter.- We do this re-generation of the
.wastfiles because the interpreters we use exit on the first failed assertion per.wast, but we want to guarantee this property for all assertions.
- We do this re-generation of the
- Ensure all assertions pass after instrumenting with
whamm.- Run the specified
whammscript on the module per set of assertions. - Output a new
.wastfile with the instrumented variation of the module with the respective assertions.
- Run the specified
Supported Interpreters
The harness generates *.bin.wast files to run on a list of engines, e.g. wizeng and the spec interpreter.
See the repo’s README.md for how to set up the interpreters to run with our test harness.
Some Ideas for Future Improvements
Report Variables
;; Use something like below to assert on the values of some report variable dynamically.
;; REPORT_TRACE(ID) --> 1, 3, 5, 6, 7

;; Use something like below to assert on report variable values!
;; WITH_WHAMM --> (assert_return (invoke "get_report_var" (i32.const 1)) (i32.const 7))
Error Handling
Errors are added to ErrorGen, defined in error.rs, and reported between compiler phases.
If an error occurs during a compilation phase, the errors are reported and the compilation is aborted.
Contributors
These are the people to thank when you’re using Whamm…either genuinely or sarcastically…if you have problems, you should let them know in a GH issue ;)
Elizabeth Gilbert, PhD student at Carnegie Mellon University (CMU).
Alex Bai, undergrad student at Tufts University.
Wavid Bowman, undergrad student at University of Florida.